
A technical analysis of why angular color stability, not raw panel brightness, determines waveguide image quality, color accuracy, and AR/XR usability in 2025.
In 2025, the rapid growth of AR and XR devices has put intense focus on small, high-resolution displays. Many teams still treat peak brightness as the dominant requirement for waveguide image quality, but a more decisive parameter is often overlooked: angular color stability. This article explains why ACS, not raw luminance alone, determines the clarity, fidelity, and usability of AR waveguide systems.

1) Introduction: Misconceptions About Brightness in AR Displays
Many AR hardware teams assume that a brighter panel automatically means a better AR image. That logic works for some flat-panel applications, but waveguide systems behave differently. Light inside a waveguide bends, reflects, diffracts, and expands across angles. These processes amplify angular color shift in ways that brightness cannot correct.
- Brightness: maximum luminance output
- Contrast: white-to-black luminance ratio
- Angular Color Stability: how well color remains consistent across viewing angles
This article explains why ACS becomes the defining metric in waveguide AR, compares OLED, LCD, and MicroLED behavior, and gives practical engineering guidance.
2) Understanding AR Waveguide Systems
2.1 How Waveguides Work
Waveguides are transparent optical structures that inject display light into a guided path, carry it through total internal reflection, and then expand it into a usable eyebox. This is how compact AR glasses can present high-resolution imagery in a lightweight form factor.
- Input coupling: the display enters the waveguide at a controlled angle
- Propagation: light reflects internally across the substrate
- Exit pupil expansion: light is expanded into the user’s viewing region
2.2 Why Angular Color Shift Occurs
Different wavelengths refract differently inside the optical path. Blue, green, and red do not follow identical angular paths, and repeated reflections can amplify that separation. The result is color inconsistency across the field of view.

2.3 The Limitations of Brightness
Even a panel with 1200 to 1500 nits can lose most of that energy through waveguide transmission losses. What remains may still be usable, but if the delivered color is split or contaminated by angular artifacts, the image can look worse than a dimmer but more chromatically stable one.
3) What Is Angular Color Stability
3.1 Definition and Measurement
Angular Color Stability describes how much the display’s chromatic coordinates shift as viewing angle changes. It is usually measured with Δu′v′ or ΔE by comparing on-axis and off-axis color patches over a defined angular range.
- Δu′v′: useful for chromaticity comparison
- ΔE: closer to perceived visual difference
- Typical setup: goniophotometer or angular measurement stage
3.2 ACS vs Other Display Metrics
ACS is distinct from brightness, contrast, uniformity, and color gamut. Those metrics still matter, but ACS specifically addresses color fidelity as angle changes — a critical behavior in waveguide optics.
3.3 Typical ACS Curves and What They Mean
ACS is often plotted as ΔE or Δu′v′ versus viewing angle. Flatter curves indicate stronger color stability. A sharp rise at small angles is a warning sign for waveguide use, where angular errors become spatial artifacts.

4) Why ACS Matters More Than Brightness in AR Waveguides
4.1 Waveguides Convert Angular Deviations Into Visible Artifacts
Waveguide optics are angle-selective. Small panel-level angular color shifts become color fringes, halos, or rainbow edges after propagation and expansion.
- Edge artifacts around text
- Ghosting and haloing from RGB mismatch
- Color fringing on bright UI elements
4.2 Brightness Is Predestined to Drop — But Color Must Survive
Waveguide efficiency often falls into the 8% to 25% range. That means the system will already lose most of the emitted light. What matters next is whether the remaining light keeps correct chromatic alignment.
4.3 Human Perception Bias: Color Errors Are More Obvious Than Dimness
Human vision notices hue shift and color splitting very quickly, especially when digital imagery is overlaid on the real world. A dim but color-correct image often appears more believable than a brighter but color-fringed one.
4.4 Example Scenarios Where ACS Beats Brightness
- Text legibility: small fonts are highly sensitive to RGB misalignment
- Medical overlays: color fidelity affects interpretation
- Industrial HUDs: alert colors must remain reliable under head motion
5) Engineering Deep-Dive: How Displays Interact with Waveguide Optics
5.1 Optical Layering: Why Stacked LCDs Lose the Angle Game
LCDs depend on multiple optical layers including polarizers, retarders, color filters, diffusers, and backlight structures. Each layer introduces angle-sensitive behavior that waveguides later magnify.

5.2 OLED’s Thin Emissive Advantage
OLED emits directly from a thin emissive stack and avoids a bulky diffusive backlight. That reduces internal angular modulation and usually produces flatter ACS behavior, which is beneficial for waveguide coupling.
- Fewer scatter layers
- No conventional backlight diffusion stack
- Better control over angular spectral behavior
5.3 Spectral Considerations: Why Peaks Matter
ACS is strongly influenced by emission bandwidth. Narrower spectral peaks can reduce differential dispersion at optical interfaces and improve RGB alignment through the waveguide path.
5.4 Mathematical Intuition
A simplified way to think about chromatic shift inside a waveguide is:
Where chromatic shift grows with angular deviation and the number of effective internal reflections. This is why a small panel-level angular error can become a visible waveguide artifact.
5.5 Practical Design Variables Engineers Can Control
- Display selection: choose panels with documented ACS curves
- Coupling optics: use gratings and coatings that reduce angular dispersion
- Spectral tuning: align display peaks to coupler response
- Calibration: use angular LUT correction when needed
5.6 Tradeoffs: When Brightness Still Matters
Brightness still matters in strong ambient light or in low-efficiency waveguides. The engineering goal is not to ignore luminance, but to prioritize ACS first and then add enough brightness to meet visibility targets.
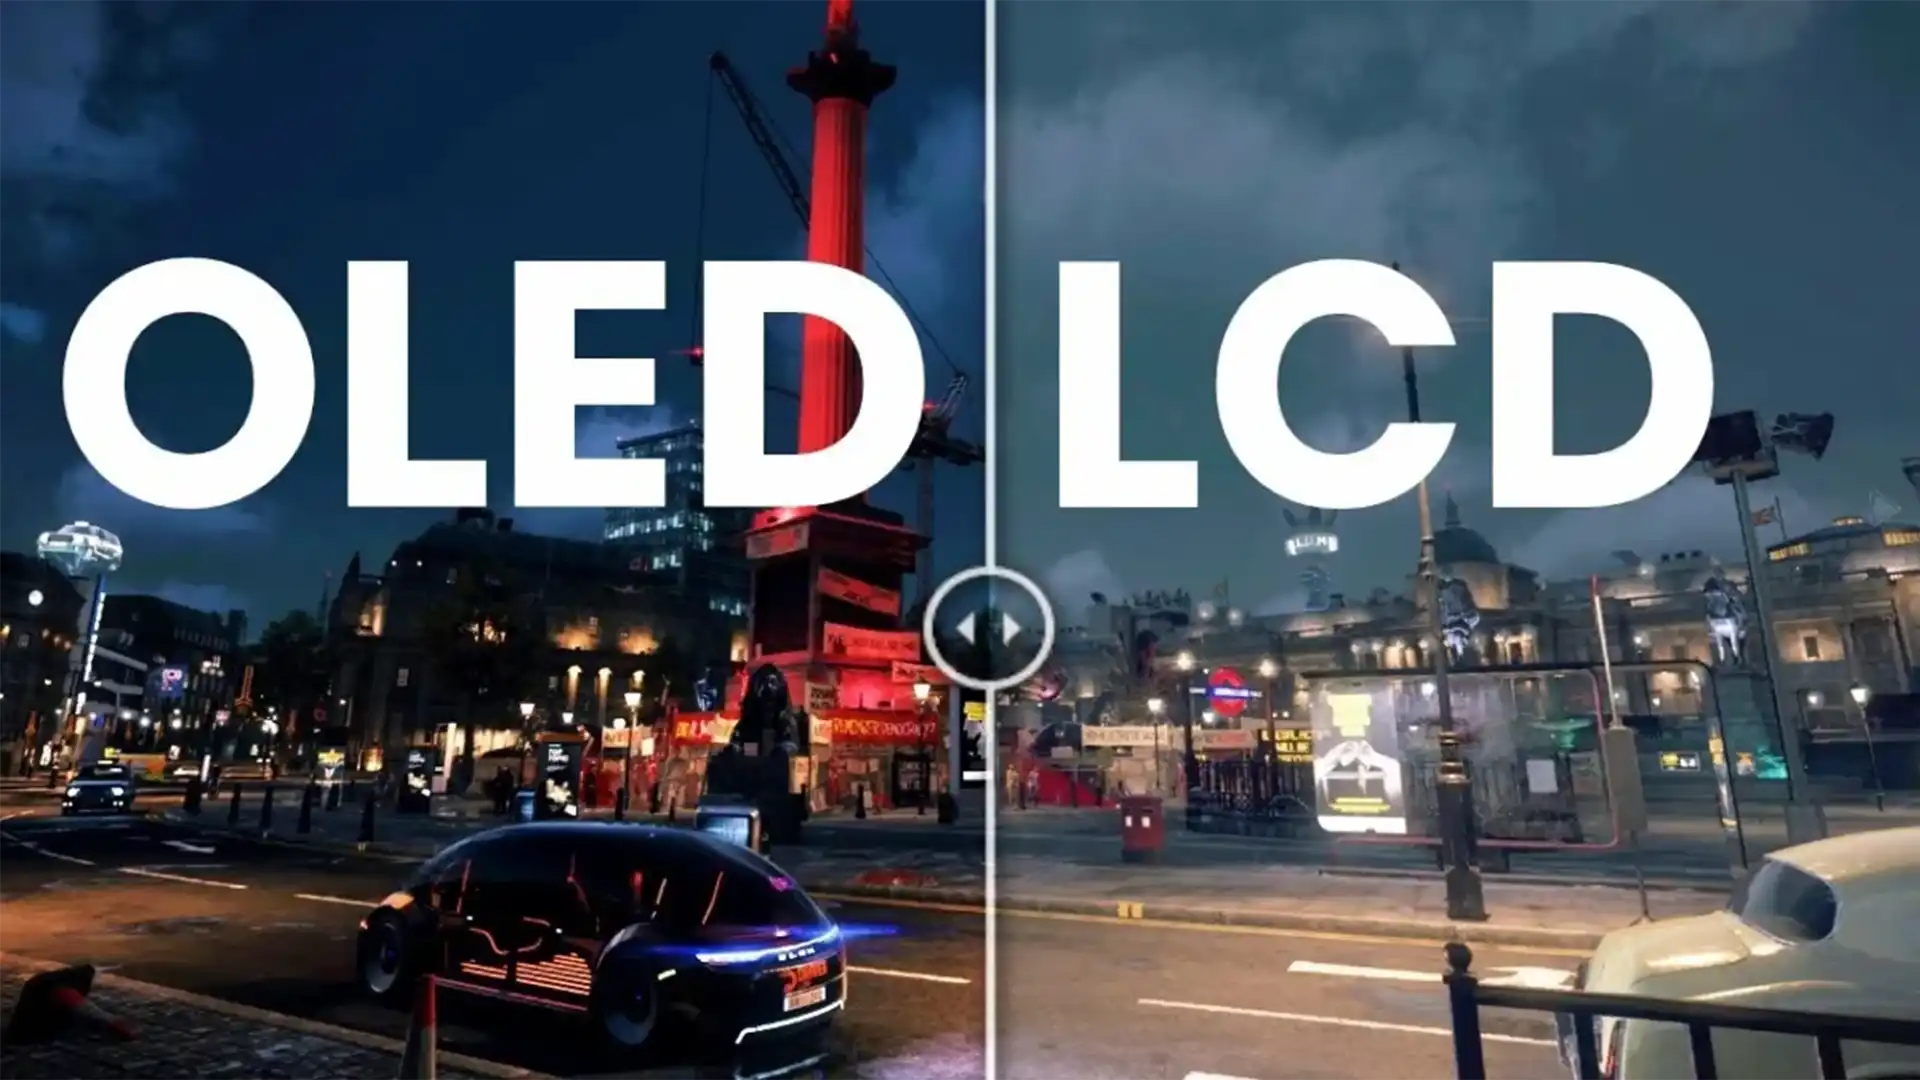
6) Comparative Testing: OLED vs LCD for Angular Color in Waveguide Coupling
6.1 Test Goal
The goal is to evaluate how color accuracy survives waveguide coupling when the panel introduces small angular deviations. This directly affects legibility and perceived realism.
6.2 Test Setup Summary
- Panels tested: OLED microdisplay, industrial LCD, and MicroLED sample
- Waveguide structure: diffractive input coupler and expanded exit pupil
- Angles sampled: from 0° to 30° off-axis
- Metrics: ΔE, Δu′v′, and subjective UI legibility
- Ambient: bright indoor scene illumination
6.3 Key Results
| Display Type | Panel Peak Brightness | ACS Performance | Perceived Output in Waveguide | Notable Artifact |
|---|---|---|---|---|
| Emissive OLED | 700-1200 nits | ΔE 1.5-3.5 at ±20° | Usable and color-stable | Rare fringing |
| Backlit LCD | 1200-2000+ nits | ΔE 5-12 at ±20° | Brighter but color-split | Strong edge fringing |
| MicroLED | 2000+ nits | Wide variance | Potentially bright but inconsistent | Local tinting and rainbow effects |
Even when LCD reaches higher peak brightness, poorer ACS often produces stronger dispersion and lower perceived image quality in the waveguide.

7) How Head Motion and Field of View Increase the Demand on ACS
7.1 Dynamic Angle Sweep
AR displays are viewed while the user moves their head. That continuously sweeps effective viewing angle and makes angle-dependent chromatic drift appear as color shimmer or rainbow trails.
7.2 FOV Expansion = Angular Spread
Waveguides expand the effective output angle to form a usable eyebox. That means one pixel may reach the eye through many output angles, amplifying any original color-angle error from the panel.
7.3 UI Impact Examples
- Menus and icons: off-axis whites can turn blue or yellow
- Thin lines: RGB components split into colored edges
- Gauge colors: warning semantics may become unreliable
8) The Fundamental Reason LCD Cannot Match OLED ACS in Waveguide Injection
8.1 Polarizer Behavior
LCD polarizers introduce angle-dependent spectral absorption, which changes apparent color before the light even enters the waveguide.
8.2 Diffuser Scatter Penalty
LCD backlights use diffusers to homogenize brightness, but that also broadens scattering angles and reduces controlled chromatic alignment in waveguide coupling.
8.3 Color Filter Thickness
Color filters act as thick spectral selectors. Their angle-dependent behavior can create additional chromatic shift that is later magnified by waveguide propagation.
OLED’s thinner emissive structure avoids much of this layered angular distortion, which is why it typically produces flatter ACS curves.

9) Optical Coating and Coupler Design to Preserve OLED ACS Performance
9.1 Match Emission Peaks to Coating Response
Diffractive gratings and coatings should be tuned so their response minimizes differential diffraction angle across the red, green, and blue emission peaks.
9.2 Avoid High-Order Ghost Cones
Designs optimized only for brightness may over-favor higher diffraction orders. That can increase color separation. Balance optical efficiency with color alignment.
9.3 Use Low-Birefringence Substrates
Low-birefringence or compensated substrates help preserve color alignment by reducing wavelength-dependent angular tilt.
9.4 Per-Angle Color LUT Compensation
For high-precision AR systems, factory-calibrated per-angle LUT compensation can reduce residual ΔE across the eyebox.
9.5 Recommended Coupler Design Targets When Using OLED
| Parameter | Target |
|---|---|
| Coupling cone | ±18° to ±22° |
| Phase error between RGB peaks | Low enough to avoid visible post-TIR separation |
| ΔE after coupling and expansion | Below strong visible-fringing threshold across FOV |
| UI text legibility | High subjective clarity across eyebox |
10) 2025 Market Context: Who Is Driving the Push for Better ACS?
AR hardware programs increasingly favor display solutions with stronger ACS behavior. This demand affects panel makers, deposition and mask processes, encapsulation, micro-module packaging, and optical coating ecosystems.
- Panel demand: high-PPI small OLED microdisplays
- Manufacturing enablers: fine mask precision, encapsulation, micro-module integration
- Waveguide ecosystem: surface-relief gratings, low-birefringence coatings, nano-imprint optics

Summary and Conclusion
For waveguide-based AR and XR systems:
- Peak brightness matters, but waveguides attenuate it heavily.
- ACS determines whether RGB information survives angular optics correctly.
- OLED’s thin emissive stack usually delivers flatter ACS behavior than LCD.
- In practical AR use, color correctness often outweighs raw light quantity.
Frequently Asked Questions
1. If brightness drops strongly in waveguides, should we still care about brightness?
Yes, but only after ACS is validated. Brightness defines usable range, while ACS defines visual quality inside the eyebox.
2. What ACS range should we target for small OLED waveguide AR?
Use an ACS target that keeps color shift below obvious visible-fringing thresholds across the intended eyebox and head-motion cone.
3. Why does fringing often appear blue and yellow first?
Blue commonly shows stronger angular dispersion through coatings and optical films, which can create visible blue-yellow edge separation after repeated waveguide interactions.
4. Can software fully fix poor ACS panels?
No. LUT compensation can reduce residual error, but it cannot fully recover from strong physical angular divergence or severe spectral mismatch at injection.
5. Does MicroLED solve brightness and ACS at the same time?
Not automatically. MicroLED can achieve high brightness, but ACS still depends on emission bandwidth, optical coupling, and coating design.
コメントを書く
このサイトはhCaptchaによって保護されており、hCaptchaプライバシーポリシーおよび利用規約が適用されます。